PANIC
Python | Plotly | Data Visualization
Overview
-
This tool provides a functional framework for constructing, transforming, and animating 3D geospatial or mathematical objects in an interactive Plotly scene.
-
Designed to streamline coordinate conversions between 2D projections and 3D space, it enables smooth linear interpolations and keyframe animations across complex geometric types.
Core Features
-
Data
Maps 2D planar coordinates directly into 3D cartesian space by automatically inferring zero-plane z-values (z = 0).
-
Projection
Processes lists of multi-dimensional tuple pairs or triplets into unified Plotly coordinate arrays (x, y, z).
-
Geometry
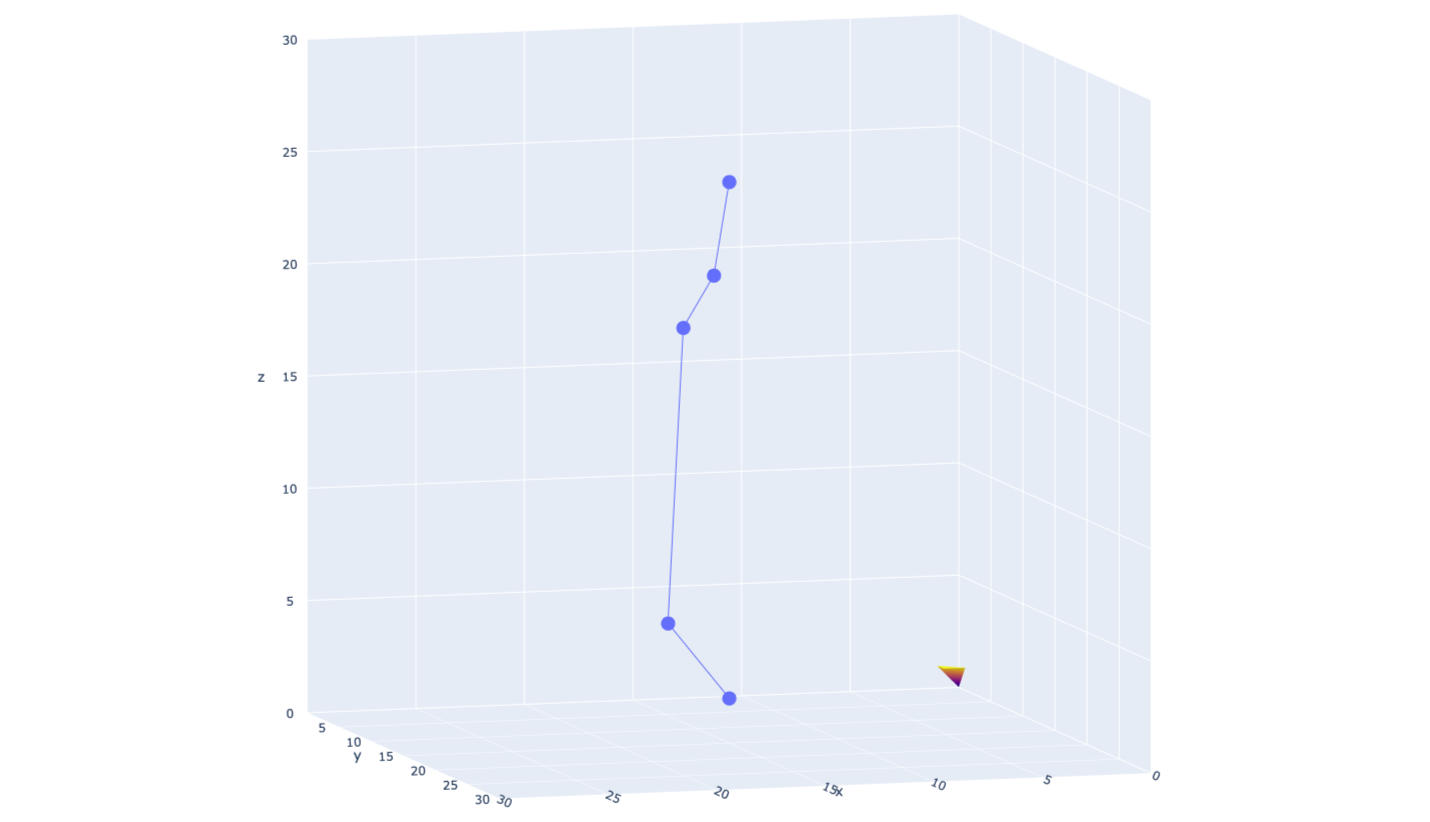
Generates 3D line plots and scatter points with customized drawing modes (e.g., markers+lines).
-
Rendering
Builds 3D scalar fields (go.Isosurface) with customizable value thresholds, minimums (isomin), and maximums (isomax). Constructs mesh surfaces (go.Mesh3d) with automatic axis-aligned color intensity mapping along X, Y, or Z gradients.
-
Motion
Calculates multi-step linear transitions across coordinate arrays, smoothly morphing position states over configurable frame steps. Outfits generated figures with animated controls, scene auto-ranging limits, and an orthographic 3D projection camera.
Tech Stack & Tools
Programming Language: Python
Visualization & Rendering: Plotly (plotly.graph_objects)
Math & Linear Interpolation: Python standard data structures, list comprehensions, zip